Turn channel data into margin decisions
We transform point of sale, marketplace and inventory data into insight that lifts margin, clears slow stock and shows which lines genuinely earn their shelf space.
Dashboards and analytics that turn sales, stock and channel data into higher margin, fewer stock-outs and decisions you can make the same day.
Overview
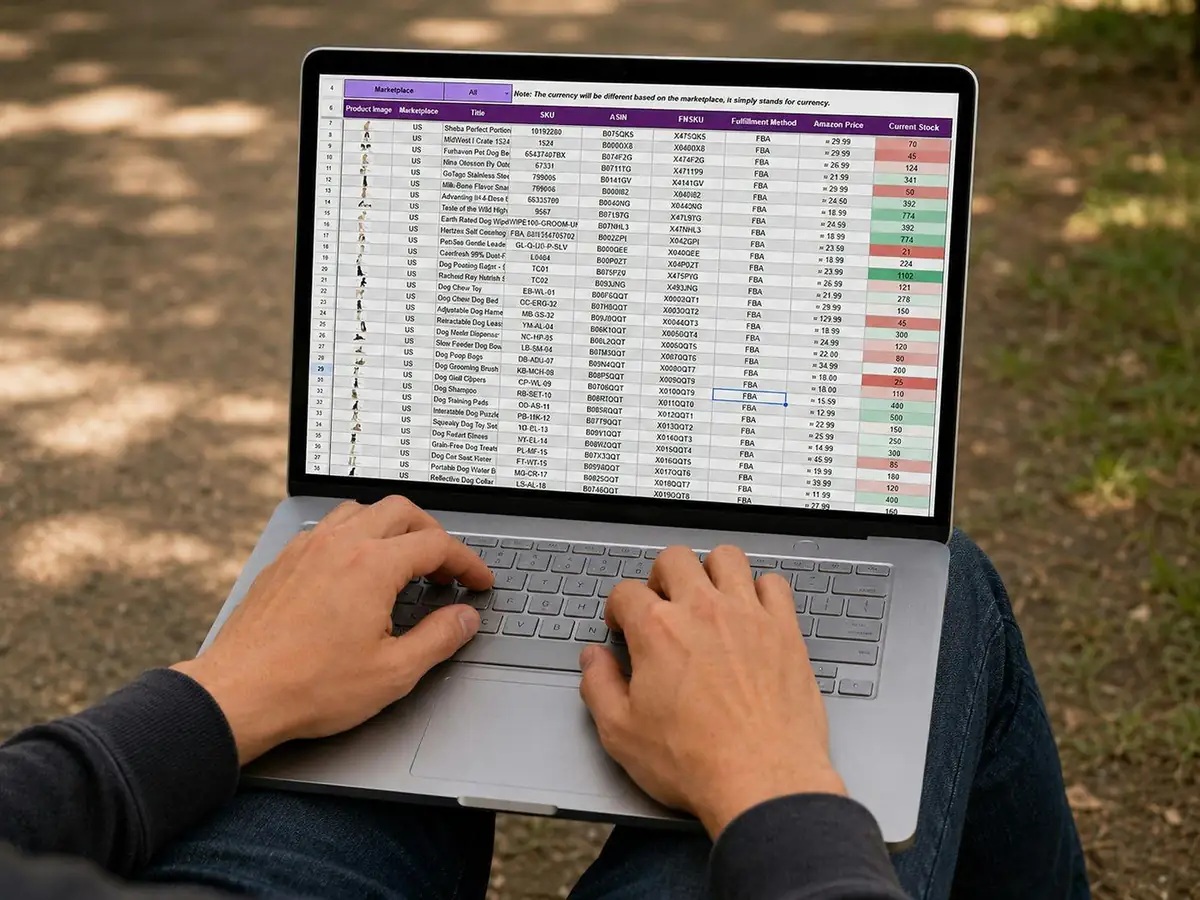
Retail data arrives from everywhere at once: point of sale, e-commerce platforms, marketplaces, warehouse and inventory systems, ad platforms and a long tail of spreadsheets. Each one tells part of the story, and reconciling them by hand means the weekly numbers land after the week is already lost.
We bring those channels into one governed view of sales, stock and margin, so merchandising, supply and finance stop arguing about whose figure is right and start acting on the same one.
Why DataBI
We transform point of sale, marketplace and inventory data into insight that lifts margin, clears slow stock and shows which lines genuinely earn their shelf space.
We have wrangled Amazon, Shopify and POS exports often enough to know where the joins break, how returns distort the picture and which numbers a buyer will actually trust.
Reporting that refreshes before the trading meeting, secure, governed and quick enough to answer the follow-up question in the room.
What we offer
Revenue, units, discount and gross margin by store, channel, category and SKU, with the drill-down a buyer always asks for next.
Cover, ageing, sell-through and stock-outs in one view, so you know what to reorder, what to mark down and what is quietly tying up cash.
Amazon, Shopify and retail partners side by side on the same definitions, including fees, returns and true contribution per channel.
Forecast demand by SKU and location from your own history and seasonality, so buying stops running on last year plus ten percent.
Basket composition, repeat rate, lifetime value and cohort behaviour, so promotions reach the customers who actually come back.
Measure what a promotion really did once cannibalisation and margin give-away are accounted for, then price the next one on evidence.
Replace manual exports with pipelines that refresh trading, stock and channel reports on their own.
Predictive models on your own history: demand, sell-through and returns you can plan around.
One governed home for POS, e-commerce, marketplace and inventory data: clean, query-ready and interoperable.
TESTIMONIALS
Azman understands the operational side of the business, not just the data. The Power BI dashboards he developed have helped us monitor performance more effectively and identify issues much faster.
We’ve worked with Azman across a wide range of reporting needs. He has consistently turned complex requirements into practical Power BI solutions that our teams can actually use as the business evolves.
Azman made complex Consumer BI data much easier to explore. The Tableau dashboards were intuitive, well structured, and gave us a clearer way to analyze the information we needed.
Let's talk
Send a message or book a free strategy session. We reply within 24 hours.
Have a question about your dashboards or analytics stack? Send a message and our team will respond directly.